원 분포를 유지한 평가Retain the original class distribution
학습 데이터만 언더샘플링으로 균형화하고, 검증·테스트 데이터는 원래의 불균형 분포를 유지했습니다.Only the training data was balanced through undersampling; validation and test retained the original imbalance.
M.S. thesis · NLP · 2023
Google Play 리뷰 3,756,164건을 수집해, 중간 평점의 모호함을 BERT 기반 2단 분류와 예측 신뢰도 측정으로 다룬 석사 연구입니다.A master’s thesis using 3,756,164 Google Play reviews to study ambiguity in the middle ratings through a BERT-based two-stage classifier and confidence estimation.
예를 들어 “괜찮지만 다시 쓰지는 않을 것”은 2점일까요, 3점일까요, 4점일까요?For example: “It’s fine, but I wouldn’t use it again.” Is that two stars, three, or four?
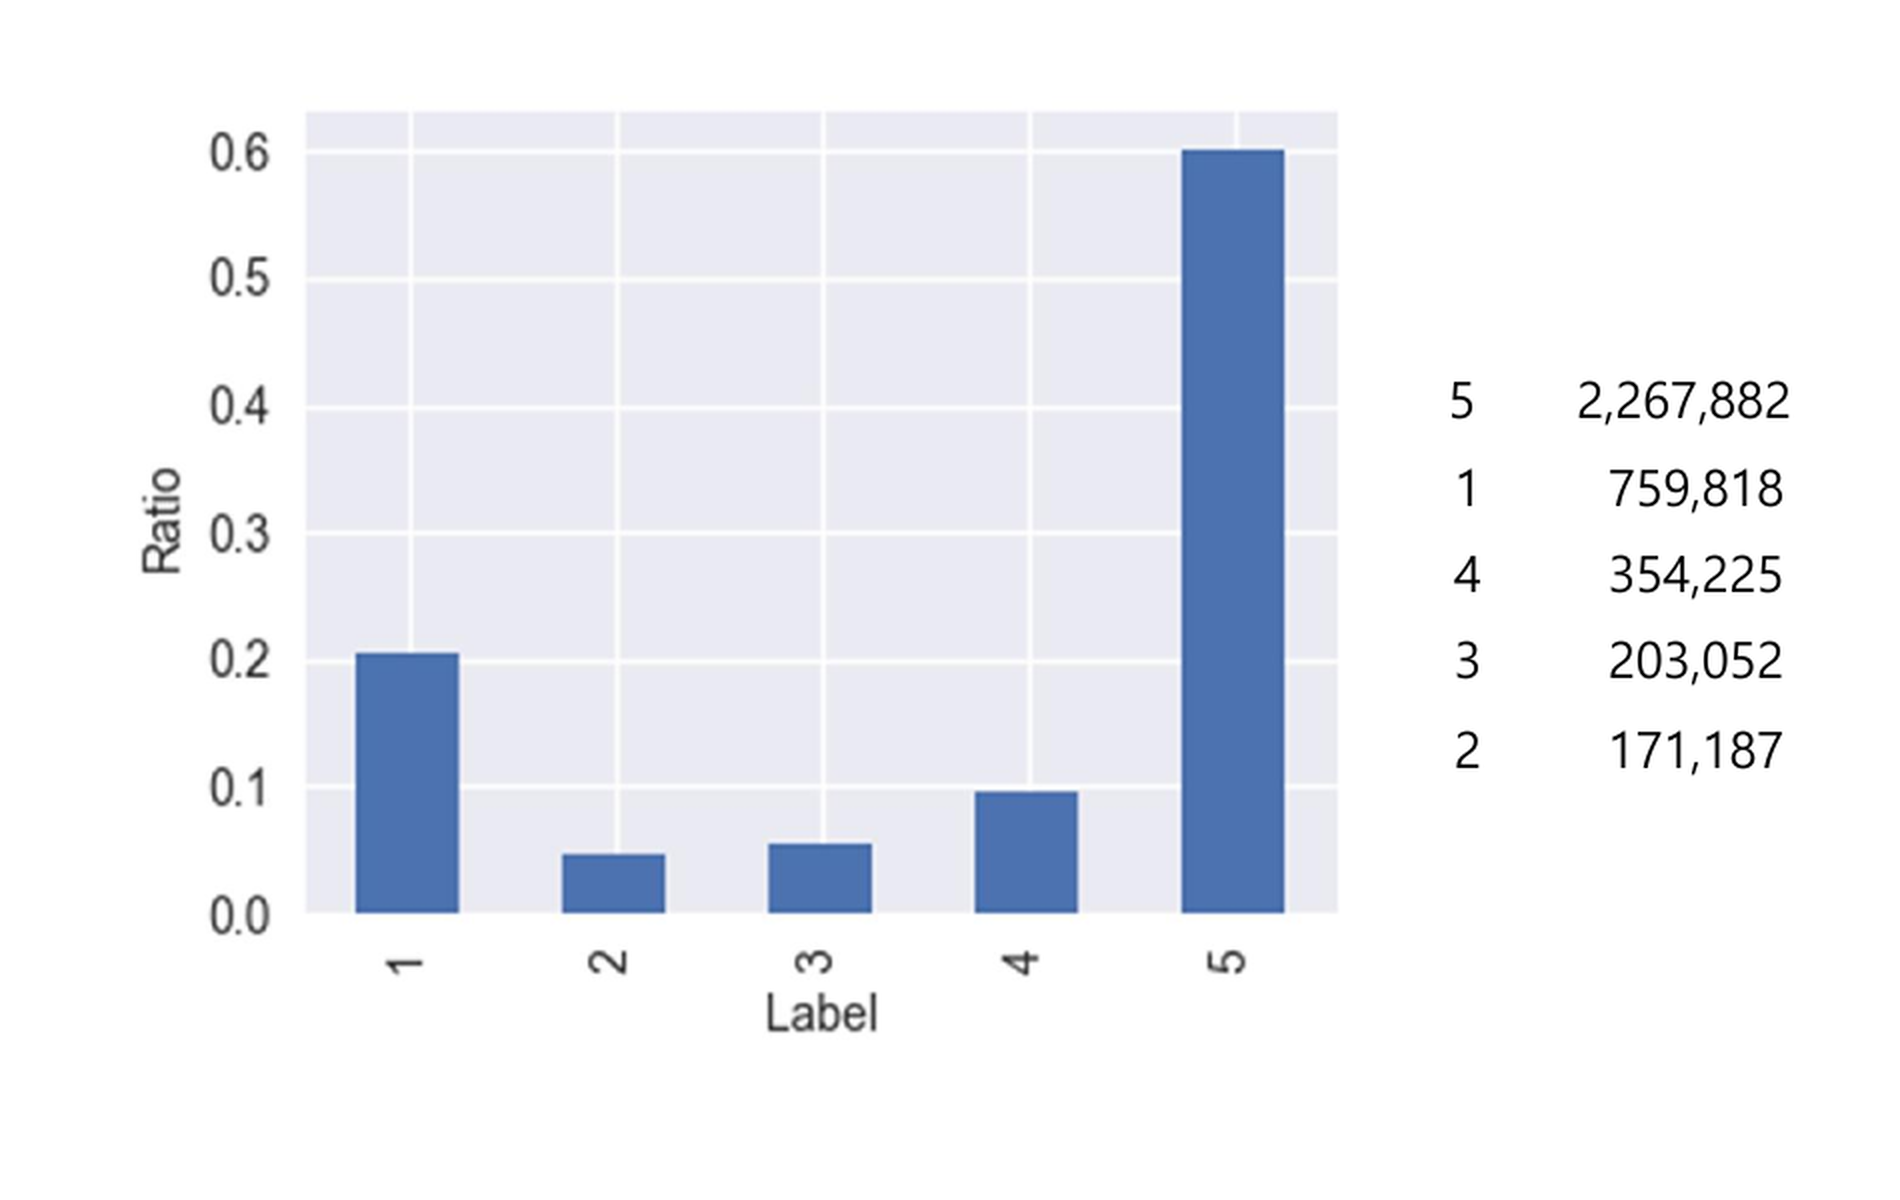
앱 리뷰의 텍스트 의미와 사용자가 선택한 1–5점 평점은 항상 일치하지 않습니다. 특히 2·3·4점은 감정과 판단 기준이 겹치며, 최종 전처리 데이터에서 5점 리뷰 2,219,925건과 2점 리뷰 169,818건 사이의 클래스 불균형도 컸습니다.Review language and a selected one-to-five-star rating do not always align. The middle classes—two, three, and four—overlap in sentiment and criteria, while the final dataset was also highly imbalanced: 2,219,925 five-star reviews versus 169,818 two-star reviews.
연구 질문은 “중간 평점만 별도로 분류하면, 한 번에 다섯 평점을 구분하는 모델보다 나은 결과를 얻을 수 있는가?”였습니다.I asked whether routing the middle ratings to a second classifier could improve prediction over a single five-class model.
Stage 1은 1점, 중간 그룹(2·3·4점), 5점을 먼저 구분합니다. Stage 2는 중간 그룹만 다시 2·3·4점으로 분류합니다. 서로 다른 난이도의 경계를 한 모델에 한꺼번에 학습시키지 않는 구조입니다.Stage 1 separates one-star reviews, a middle group of two-, three-, and four-star reviews, and five-star reviews. Stage 2 then classifies the middle group into its three individual ratings. This avoids forcing a single model to learn boundaries of very different difficulty at once.
학습 데이터만 언더샘플링으로 균형화하고, 검증·테스트 데이터는 원래의 불균형 분포를 유지했습니다.Only the training data was balanced through undersampling; validation and test retained the original imbalance.
BERT, BiLSTM, BiGRU, Text-CNN, 감성 분석과 전통적 머신러닝 접근을 폭넓게 비교했습니다.Compared BERT, BiLSTM, BiGRU, Text-CNN, sentiment, and traditional machine-learning approaches.
점수만 내는 대신 낮은 신뢰도의 리뷰를 구분하는 방법을 추가로 평가했습니다.Evaluated a method for identifying lower-confidence reviews alongside the prediction.
2022년 11월 10일 기준 전 세계 유료·무료 상위 앱 각 45개, 총 90개 앱에서 리뷰·평점 레코드 3,756,164건을 수집했습니다. 전처리 후 3,694,069건을 모델링 데이터로 사용했습니다.I collected 3,756,164 review-rating records from 90 apps—the top 45 paid and 45 free apps worldwide as of November 10, 2022. After preprocessing, 3,694,069 records were used for modeling.
수집한 리뷰·평점 레코드Collected review-rating records
전처리 후 모델링 데이터Preprocessed modeling dataset
비교한 단일 단계 모델One-stage models compared
평가한 Stage 1 × Stage 2 조합Stage 1 × Stage 2 combinations evaluated
성과 지표는 147,763건의 별도 테스트셋에서 평가한 5개 평점 분류 결과입니다.Performance was measured on a held-out test set of 147,763 reviews across five rating classes.
가장 강한 단일 단계 BERT-BiLSTM의 정확도는 69.53%였습니다. 같은 구조 2단계 최고는 75.45%, 교차 구조 최고는 75.47%였고, Simple Hard Voting의 한 변형에서 최고 정확도 75.78%를 기록했습니다. 단일 단계 최고보다 6.25%p 높은 결과입니다.The strongest one-stage BERT-BiLSTM reached 69.53% accuracy. The best same-structure two-stage model reached 75.45%, the best cross-structure combination 75.47%, and one Simple Hard Voting variant reached 75.78%—6.25 percentage points above the strongest one-stage result.
최고 가중 F1은 74.09%였습니다. 최고 정확도와 최고 가중 F1은 서로 다른 동률 처리 방식에서 나온 결과입니다.The highest weighted F1 was 74.09%. The highest accuracy and weighted F1 came from different tie-breaking variants.
정확도 상승만으로 모든 평점을 동일하게 잘 구분했다고 볼 수는 없습니다. 클래스 불균형과 중간 평점의 모호함이 남아 있어, 예측 신뢰도가 낮은 사례를 별도로 식별하고 결과의 적용 범위를 명시했습니다.Higher accuracy does not mean every rating class was separated equally well. Class imbalance and ambiguity in the middle ratings remained, so I also identified lower-confidence predictions and stated the limits of the result.
2023년 석사 연구 · 오프라인 실험 결과2023 master’s thesis · Offline experimental results
이 연구에서 가장 크게 배운 것은 최종 점수보다 공정한 비교 조건을 만드는 일이었습니다. 지금도 정성 조사에서 나온 가설을 측정 가능한 질문으로 바꾸고, 결과의 불확실성까지 제품 판단에 포함합니다.The most useful lesson was not the final score; it was learning to define fair comparisons. I now use that discipline to turn qualitative findings into testable hypotheses and to carry uncertainty into product decisions.
데이터가 결정을 대신한다고 보지는 않습니다. 어떤 가설을 더 믿어도 되는지, 어디까지 조심해야 하는지를 판단하는 근거로 씁니다.Data does not replace judgment for me. It shows which hypotheses deserve more confidence—and where caution is still needed.